SlideShare a Scribd company logo
1 of 2
Download to read offline
Market Share Totals                                                                             Prudential Fox & Roach


MLS: TReND        Date: 04/01/2009 - 03/31/2010    Type: Broker          Status: Sold            Price: All                             Construction Type: All             Bedrooms: All      Bathrooms: All
Property Types:   Residential: (Single Family, Twin/Semi-Detached, Unit/Flat, Row/Townhouse/Cluster, Mobile, Other)
Counties:         Montgomery

BrokerMetrics®                                                                                          1 of 2                                                                                         04/23/10
                                           Information not guaranteed. © 2010 - 2011 Terradatum and its suppliers and licensors (http://www.terradatum.com/metrics/licensors).
Market Share Totals                                                                            Prudential Fox & Roach
                                                                                         Total $ Volume

                                                                                                                                                                                   Prod       Prod
                                                                                                                                               Market             Avg            Agents     Agents
    #                Name                 List #             List $        Sell #             Sell $       Total #             Total $        Share %            Price     DOM   (Total)   (Search)      Ofcs
    1 Prudential Fox & Roach              1,276       537,863,343          1,293       516,164,295          2,569      1,054,027,638             22.49        410,287       98    1,678        779         33
    2 Long And Foster                       374       131,770,784            371       120,780,763            745        252,551,547               5.39       338,995      101      546        313         15
    3 Keller Williams Real Estate           361       111,857,015            393       124,567,986            754        236,425,001               5.04       313,561       75      152        105          2
    4 Weichert Realtors                     356       105,793,434            449       123,711,359            805        229,504,793               4.90       285,099       76      465        250         17
    5 Coldwell Banker Preferred             329       103,695,717            301        99,785,548            630        203,481,265               4.34       322,986       92      304        149          7
    6 Century 21 Alliance                   367        97,594,699            356        89,976,494            723        187,571,193               4.00       259,435       87      469        188         16
    7 RE/MAX Action Realty                  305        89,331,880            263        77,955,670            568        167,287,550               3.57       294,520       63      108         98          1
    8 RE/MAX Services                       182        50,306,750            176        52,249,819            358        102,556,569               2.19       286,471       77       58         52          1
    9 RE/MAX 440                            171        42,283,443            186        44,307,939            357          86,591,382              1.85       242,553       92       89         82          7
   10 Keller Williams Realty Group          222        43,197,229            140        28,201,040            362          71,398,269              1.52       197,233       81       95         71          2


Subtotals/Averages                        3,943     1,313,694,294          3,928     1,277,700,913          7,871      2,591,395,207             55.29        329,233       88    3,964      2,087        101

MLS Totals/Averages                       7,914     2,343,257,453          7,914     2,343,257,453         15,828      4,686,514,906            100.00        296,090       86    9,629      4,564        700


BrokerMetrics®                                                                                    2 of 2                                                                                              04/23/10
                                     Information not guaranteed. © 2010 - 2011 Terradatum and its suppliers and licensors (http://www.terradatum.com/metrics/licensors).

More Related Content

What's hot (14)

June 2010 Chester County Market Share
June 2010 Chester County Market ShareJune 2010 Chester County Market Share
June 2010 Chester County Market Share
 
May 2010 Montgomery County Market Share
May 2010 Montgomery County Market ShareMay 2010 Montgomery County Market Share
May 2010 Montgomery County Market Share
 
Montgomery County Market Share
Montgomery County Market ShareMontgomery County Market Share
Montgomery County Market Share
 
December 2009 Montgomery County Market Share
December 2009 Montgomery County Market ShareDecember 2009 Montgomery County Market Share
December 2009 Montgomery County Market Share
 
Montgomery county market share
Montgomery county market shareMontgomery county market share
Montgomery county market share
 
July 2010 Chester County Market Share
July 2010 Chester County Market ShareJuly 2010 Chester County Market Share
July 2010 Chester County Market Share
 
2010 Delaware County Market Share
2010 Delaware County Market Share2010 Delaware County Market Share
2010 Delaware County Market Share
 
2010 Feburary Bucks County Market Share
2010 Feburary Bucks County Market Share2010 Feburary Bucks County Market Share
2010 Feburary Bucks County Market Share
 
Chester County Market Share
Chester County Market ShareChester County Market Share
Chester County Market Share
 
May 2010 Chester County Market Share
May 2010 Chester County Market ShareMay 2010 Chester County Market Share
May 2010 Chester County Market Share
 
April Chester County Market Share
April Chester County Market ShareApril Chester County Market Share
April Chester County Market Share
 
Bucks County Market Share
Bucks County Market ShareBucks County Market Share
Bucks County Market Share
 
Montgomery County Market Share
Montgomery County Market ShareMontgomery County Market Share
Montgomery County Market Share
 
April Bucks County Market Share
April Bucks County Market ShareApril Bucks County Market Share
April Bucks County Market Share
 

Similar to Montgomery county market share

Similar to Montgomery county market share (17)

2010 Chester County Market Share Analysis
2010 Chester County Market Share Analysis2010 Chester County Market Share Analysis
2010 Chester County Market Share Analysis
 
June 2010 Chester County Market Share Analysis
June 2010 Chester County Market Share AnalysisJune 2010 Chester County Market Share Analysis
June 2010 Chester County Market Share Analysis
 
January 2010 Chester County M A R K E T S H A R E
January 2010 Chester  County  M A R K E T  S H A R EJanuary 2010 Chester  County  M A R K E T  S H A R E
January 2010 Chester County M A R K E T S H A R E
 
September 2010 Montgomery county Market Share
September 2010 Montgomery county Market ShareSeptember 2010 Montgomery county Market Share
September 2010 Montgomery county Market Share
 
July 2010 Montgomery County Market Share
July 2010 Montgomery County Market ShareJuly 2010 Montgomery County Market Share
July 2010 Montgomery County Market Share
 
January 2010 Montgomery County Market Share
January 2010 Montgomery County Market ShareJanuary 2010 Montgomery County Market Share
January 2010 Montgomery County Market Share
 
2010 February Montgomery County Market Share
2010 February Montgomery County Market Share2010 February Montgomery County Market Share
2010 February Montgomery County Market Share
 
2010 March Bucks County Market Share Analysis
2010 March Bucks County Market Share Analysis2010 March Bucks County Market Share Analysis
2010 March Bucks County Market Share Analysis
 
Bucks county market share
Bucks county market shareBucks county market share
Bucks county market share
 
Bucks County Market Share
Bucks County Market ShareBucks County Market Share
Bucks County Market Share
 
Bucks County Market Share
Bucks County Market ShareBucks County Market Share
Bucks County Market Share
 
2010 February Philadelphia County Market Share
2010 February Philadelphia County Market Share2010 February Philadelphia County Market Share
2010 February Philadelphia County Market Share
 
July 2009 Chester County Market Share
July 2009 Chester County Market ShareJuly 2009 Chester County Market Share
July 2009 Chester County Market Share
 
June 2010 Delaware County Market Share Analysis
June 2010 Delaware County Market Share AnalysisJune 2010 Delaware County Market Share Analysis
June 2010 Delaware County Market Share Analysis
 
May 2010 Philadelphia County Market Share
May 2010 Philadelphia County Market ShareMay 2010 Philadelphia County Market Share
May 2010 Philadelphia County Market Share
 
2010 March Chester County Market Share Analysis
2010 March Chester County Market Share Analysis2010 March Chester County Market Share Analysis
2010 March Chester County Market Share Analysis
 
June 2010 Bucks County Market Share
June 2010 Bucks County Market ShareJune 2010 Bucks County Market Share
June 2010 Bucks County Market Share
 

More from Prudential Fox & Roach, Realtors

September 2010 Montgomery County Month Supply of Inventory and Average Days o...
September 2010 Montgomery County Month Supply of Inventory and Average Days o...September 2010 Montgomery County Month Supply of Inventory and Average Days o...
September 2010 Montgomery County Month Supply of Inventory and Average Days o...Prudential Fox & Roach, Realtors
 
July 2010 Montgomery County Month Supply of Inventory and Average Days on Market
July 2010 Montgomery County Month Supply of Inventory and Average Days on MarketJuly 2010 Montgomery County Month Supply of Inventory and Average Days on Market
July 2010 Montgomery County Month Supply of Inventory and Average Days on MarketPrudential Fox & Roach, Realtors
 

More from Prudential Fox & Roach, Realtors (20)

Bucks county market share
Bucks county market shareBucks county market share
Bucks county market share
 
Bucks county market share
Bucks county market shareBucks county market share
Bucks county market share
 
Bucks county market share
Bucks county market shareBucks county market share
Bucks county market share
 
September 2010 Bucks County Market Share
September 2010 Bucks County Market ShareSeptember 2010 Bucks County Market Share
September 2010 Bucks County Market Share
 
Bucks County Basic Supply and Demand
Bucks County Basic Supply and DemandBucks County Basic Supply and Demand
Bucks County Basic Supply and Demand
 
Montgomery county sold median price
Montgomery county sold median priceMontgomery county sold median price
Montgomery county sold median price
 
September 2010 Montgomery County Month Supply of Inventory and Average Days o...
September 2010 Montgomery County Month Supply of Inventory and Average Days o...September 2010 Montgomery County Month Supply of Inventory and Average Days o...
September 2010 Montgomery County Month Supply of Inventory and Average Days o...
 
September 2010 Montgomery County Sold Median Price
September 2010 Montgomery County Sold Median PriceSeptember 2010 Montgomery County Sold Median Price
September 2010 Montgomery County Sold Median Price
 
September 2010 Montgomery County Basic Supply And Demand
September 2010 Montgomery County Basic Supply And DemandSeptember 2010 Montgomery County Basic Supply And Demand
September 2010 Montgomery County Basic Supply And Demand
 
July 2010 Philadelphia County Market Share
July 2010 Philadelphia County Market ShareJuly 2010 Philadelphia County Market Share
July 2010 Philadelphia County Market Share
 
July 2010 Montgomery County Month Supply of Inventory and Average Days on Market
July 2010 Montgomery County Month Supply of Inventory and Average Days on MarketJuly 2010 Montgomery County Month Supply of Inventory and Average Days on Market
July 2010 Montgomery County Month Supply of Inventory and Average Days on Market
 
July 2010 Montgomery County Sold Median Price
July 2010 Montgomery County Sold Median PriceJuly 2010 Montgomery County Sold Median Price
July 2010 Montgomery County Sold Median Price
 
July 2010 Montgomery County Basic Supply and Demand
July 2010 Montgomery County Basic Supply and DemandJuly 2010 Montgomery County Basic Supply and Demand
July 2010 Montgomery County Basic Supply and Demand
 
July 2010 Philadelphia County Basic Supply and Demand
July 2010 Philadelphia County Basic Supply and DemandJuly 2010 Philadelphia County Basic Supply and Demand
July 2010 Philadelphia County Basic Supply and Demand
 
Philadelphia county sold median price
Philadelphia county sold median pricePhiladelphia county sold median price
Philadelphia county sold median price
 
Montgomery county msi and avg dom
Montgomery county msi and avg domMontgomery county msi and avg dom
Montgomery county msi and avg dom
 
Montgomery county basic supply and demand
Montgomery county basic supply and demandMontgomery county basic supply and demand
Montgomery county basic supply and demand
 
Montgomery county sold median price
Montgomery county sold median priceMontgomery county sold median price
Montgomery county sold median price
 
Delaware county msi and avg dom
Delaware county msi and avg domDelaware county msi and avg dom
Delaware county msi and avg dom
 
Delaware county market share
Delaware county market shareDelaware county market share
Delaware county market share
 

Recently uploaded

Difference Between Search & Browse Methods in Odoo 17
Difference Between Search & Browse Methods in Odoo 17Difference Between Search & Browse Methods in Odoo 17
Difference Between Search & Browse Methods in Odoo 17Celine George
 
Alper Gobel In Media Res Media Component
Alper Gobel In Media Res Media ComponentAlper Gobel In Media Res Media Component
Alper Gobel In Media Res Media ComponentInMediaRes1
 
Crayon Activity Handout For the Crayon A
Crayon Activity Handout For the Crayon ACrayon Activity Handout For the Crayon A
Crayon Activity Handout For the Crayon AUnboundStockton
 
Framing an Appropriate Research Question 6b9b26d93da94caf993c038d9efcdedb.pdf
Framing an Appropriate Research Question 6b9b26d93da94caf993c038d9efcdedb.pdfFraming an Appropriate Research Question 6b9b26d93da94caf993c038d9efcdedb.pdf
Framing an Appropriate Research Question 6b9b26d93da94caf993c038d9efcdedb.pdfUjwalaBharambe
 
Procuring digital preservation CAN be quick and painless with our new dynamic...
Procuring digital preservation CAN be quick and painless with our new dynamic...Procuring digital preservation CAN be quick and painless with our new dynamic...
Procuring digital preservation CAN be quick and painless with our new dynamic...Jisc
 
Full Stack Web Development Course for Beginners
Full Stack Web Development Course  for BeginnersFull Stack Web Development Course  for Beginners
Full Stack Web Development Course for BeginnersSabitha Banu
 
ENGLISH6-Q4-W3.pptxqurter our high choom
ENGLISH6-Q4-W3.pptxqurter our high choomENGLISH6-Q4-W3.pptxqurter our high choom
ENGLISH6-Q4-W3.pptxqurter our high choomnelietumpap1
 
AMERICAN LANGUAGE HUB_Level2_Student'sBook_Answerkey.pdf
AMERICAN LANGUAGE HUB_Level2_Student'sBook_Answerkey.pdfAMERICAN LANGUAGE HUB_Level2_Student'sBook_Answerkey.pdf
AMERICAN LANGUAGE HUB_Level2_Student'sBook_Answerkey.pdfphamnguyenenglishnb
 
Roles & Responsibilities in Pharmacovigilance
Roles & Responsibilities in PharmacovigilanceRoles & Responsibilities in Pharmacovigilance
Roles & Responsibilities in PharmacovigilanceSamikshaHamane
 
ECONOMIC CONTEXT - PAPER 1 Q3: NEWSPAPERS.pptx
ECONOMIC CONTEXT - PAPER 1 Q3: NEWSPAPERS.pptxECONOMIC CONTEXT - PAPER 1 Q3: NEWSPAPERS.pptx
ECONOMIC CONTEXT - PAPER 1 Q3: NEWSPAPERS.pptxiammrhaywood
 
AmericanHighSchoolsprezentacijaoskolama.
AmericanHighSchoolsprezentacijaoskolama.AmericanHighSchoolsprezentacijaoskolama.
AmericanHighSchoolsprezentacijaoskolama.arsicmarija21
 
Computed Fields and api Depends in the Odoo 17
Computed Fields and api Depends in the Odoo 17Computed Fields and api Depends in the Odoo 17
Computed Fields and api Depends in the Odoo 17Celine George
 
EPANDING THE CONTENT OF AN OUTLINE using notes.pptx
EPANDING THE CONTENT OF AN OUTLINE using notes.pptxEPANDING THE CONTENT OF AN OUTLINE using notes.pptx
EPANDING THE CONTENT OF AN OUTLINE using notes.pptxRaymartEstabillo3
 
Solving Puzzles Benefits Everyone (English).pptx
Solving Puzzles Benefits Everyone (English).pptxSolving Puzzles Benefits Everyone (English).pptx
Solving Puzzles Benefits Everyone (English).pptxOH TEIK BIN
 
Romantic Opera MUSIC FOR GRADE NINE pptx
Romantic Opera MUSIC FOR GRADE NINE pptxRomantic Opera MUSIC FOR GRADE NINE pptx
Romantic Opera MUSIC FOR GRADE NINE pptxsqpmdrvczh
 
What is Model Inheritance in Odoo 17 ERP
What is Model Inheritance in Odoo 17 ERPWhat is Model Inheritance in Odoo 17 ERP
What is Model Inheritance in Odoo 17 ERPCeline George
 
ACC 2024 Chronicles. Cardiology. Exam.pdf
ACC 2024 Chronicles. Cardiology. Exam.pdfACC 2024 Chronicles. Cardiology. Exam.pdf
ACC 2024 Chronicles. Cardiology. Exam.pdfSpandanaRallapalli
 
Influencing policy (training slides from Fast Track Impact)
Influencing policy (training slides from Fast Track Impact)Influencing policy (training slides from Fast Track Impact)
Influencing policy (training slides from Fast Track Impact)Mark Reed
 

Recently uploaded (20)

Difference Between Search & Browse Methods in Odoo 17
Difference Between Search & Browse Methods in Odoo 17Difference Between Search & Browse Methods in Odoo 17
Difference Between Search & Browse Methods in Odoo 17
 
Alper Gobel In Media Res Media Component
Alper Gobel In Media Res Media ComponentAlper Gobel In Media Res Media Component
Alper Gobel In Media Res Media Component
 
Crayon Activity Handout For the Crayon A
Crayon Activity Handout For the Crayon ACrayon Activity Handout For the Crayon A
Crayon Activity Handout For the Crayon A
 
Framing an Appropriate Research Question 6b9b26d93da94caf993c038d9efcdedb.pdf
Framing an Appropriate Research Question 6b9b26d93da94caf993c038d9efcdedb.pdfFraming an Appropriate Research Question 6b9b26d93da94caf993c038d9efcdedb.pdf
Framing an Appropriate Research Question 6b9b26d93da94caf993c038d9efcdedb.pdf
 
OS-operating systems- ch04 (Threads) ...
OS-operating systems- ch04 (Threads) ...OS-operating systems- ch04 (Threads) ...
OS-operating systems- ch04 (Threads) ...
 
Procuring digital preservation CAN be quick and painless with our new dynamic...
Procuring digital preservation CAN be quick and painless with our new dynamic...Procuring digital preservation CAN be quick and painless with our new dynamic...
Procuring digital preservation CAN be quick and painless with our new dynamic...
 
Full Stack Web Development Course for Beginners
Full Stack Web Development Course  for BeginnersFull Stack Web Development Course  for Beginners
Full Stack Web Development Course for Beginners
 
ENGLISH6-Q4-W3.pptxqurter our high choom
ENGLISH6-Q4-W3.pptxqurter our high choomENGLISH6-Q4-W3.pptxqurter our high choom
ENGLISH6-Q4-W3.pptxqurter our high choom
 
AMERICAN LANGUAGE HUB_Level2_Student'sBook_Answerkey.pdf
AMERICAN LANGUAGE HUB_Level2_Student'sBook_Answerkey.pdfAMERICAN LANGUAGE HUB_Level2_Student'sBook_Answerkey.pdf
AMERICAN LANGUAGE HUB_Level2_Student'sBook_Answerkey.pdf
 
Raw materials used in Herbal Cosmetics.pptx
Raw materials used in Herbal Cosmetics.pptxRaw materials used in Herbal Cosmetics.pptx
Raw materials used in Herbal Cosmetics.pptx
 
Roles & Responsibilities in Pharmacovigilance
Roles & Responsibilities in PharmacovigilanceRoles & Responsibilities in Pharmacovigilance
Roles & Responsibilities in Pharmacovigilance
 
ECONOMIC CONTEXT - PAPER 1 Q3: NEWSPAPERS.pptx
ECONOMIC CONTEXT - PAPER 1 Q3: NEWSPAPERS.pptxECONOMIC CONTEXT - PAPER 1 Q3: NEWSPAPERS.pptx
ECONOMIC CONTEXT - PAPER 1 Q3: NEWSPAPERS.pptx
 
AmericanHighSchoolsprezentacijaoskolama.
AmericanHighSchoolsprezentacijaoskolama.AmericanHighSchoolsprezentacijaoskolama.
AmericanHighSchoolsprezentacijaoskolama.
 
Computed Fields and api Depends in the Odoo 17
Computed Fields and api Depends in the Odoo 17Computed Fields and api Depends in the Odoo 17
Computed Fields and api Depends in the Odoo 17
 
EPANDING THE CONTENT OF AN OUTLINE using notes.pptx
EPANDING THE CONTENT OF AN OUTLINE using notes.pptxEPANDING THE CONTENT OF AN OUTLINE using notes.pptx
EPANDING THE CONTENT OF AN OUTLINE using notes.pptx
 
Solving Puzzles Benefits Everyone (English).pptx
Solving Puzzles Benefits Everyone (English).pptxSolving Puzzles Benefits Everyone (English).pptx
Solving Puzzles Benefits Everyone (English).pptx
 
Romantic Opera MUSIC FOR GRADE NINE pptx
Romantic Opera MUSIC FOR GRADE NINE pptxRomantic Opera MUSIC FOR GRADE NINE pptx
Romantic Opera MUSIC FOR GRADE NINE pptx
 
What is Model Inheritance in Odoo 17 ERP
What is Model Inheritance in Odoo 17 ERPWhat is Model Inheritance in Odoo 17 ERP
What is Model Inheritance in Odoo 17 ERP
 
ACC 2024 Chronicles. Cardiology. Exam.pdf
ACC 2024 Chronicles. Cardiology. Exam.pdfACC 2024 Chronicles. Cardiology. Exam.pdf
ACC 2024 Chronicles. Cardiology. Exam.pdf
 
Influencing policy (training slides from Fast Track Impact)
Influencing policy (training slides from Fast Track Impact)Influencing policy (training slides from Fast Track Impact)
Influencing policy (training slides from Fast Track Impact)
 

Montgomery county market share

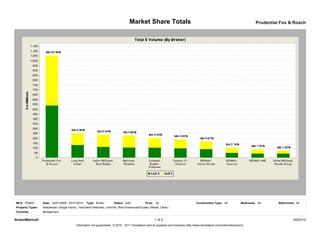
  • 1. Market Share Totals Prudential Fox & Roach MLS: TReND Date: 04/01/2009 - 03/31/2010 Type: Broker Status: Sold Price: All Construction Type: All Bedrooms: All Bathrooms: All Property Types: Residential: (Single Family, Twin/Semi-Detached, Unit/Flat, Row/Townhouse/Cluster, Mobile, Other) Counties: Montgomery BrokerMetrics® 1 of 2 04/23/10 Information not guaranteed. © 2010 - 2011 Terradatum and its suppliers and licensors (http://www.terradatum.com/metrics/licensors).
  • 2. Market Share Totals Prudential Fox & Roach Total $ Volume Prod Prod Market Avg Agents Agents # Name List # List $ Sell # Sell $ Total # Total $ Share % Price DOM (Total) (Search) Ofcs 1 Prudential Fox & Roach 1,276 537,863,343 1,293 516,164,295 2,569 1,054,027,638 22.49 410,287 98 1,678 779 33 2 Long And Foster 374 131,770,784 371 120,780,763 745 252,551,547 5.39 338,995 101 546 313 15 3 Keller Williams Real Estate 361 111,857,015 393 124,567,986 754 236,425,001 5.04 313,561 75 152 105 2 4 Weichert Realtors 356 105,793,434 449 123,711,359 805 229,504,793 4.90 285,099 76 465 250 17 5 Coldwell Banker Preferred 329 103,695,717 301 99,785,548 630 203,481,265 4.34 322,986 92 304 149 7 6 Century 21 Alliance 367 97,594,699 356 89,976,494 723 187,571,193 4.00 259,435 87 469 188 16 7 RE/MAX Action Realty 305 89,331,880 263 77,955,670 568 167,287,550 3.57 294,520 63 108 98 1 8 RE/MAX Services 182 50,306,750 176 52,249,819 358 102,556,569 2.19 286,471 77 58 52 1 9 RE/MAX 440 171 42,283,443 186 44,307,939 357 86,591,382 1.85 242,553 92 89 82 7 10 Keller Williams Realty Group 222 43,197,229 140 28,201,040 362 71,398,269 1.52 197,233 81 95 71 2 Subtotals/Averages 3,943 1,313,694,294 3,928 1,277,700,913 7,871 2,591,395,207 55.29 329,233 88 3,964 2,087 101 MLS Totals/Averages 7,914 2,343,257,453 7,914 2,343,257,453 15,828 4,686,514,906 100.00 296,090 86 9,629 4,564 700 BrokerMetrics® 2 of 2 04/23/10 Information not guaranteed. © 2010 - 2011 Terradatum and its suppliers and licensors (http://www.terradatum.com/metrics/licensors).